Showing posts with label Commodity Market. Show all posts

Sunday, 10 April 2016

Stock Market and Oil Prices Correlation: Why From 25% to 91%?

Oil and water do not mix together but stock prices and oil prices does!
Both, the oil prices and stock prices were declining with the correlation of about 91% when oil prices dropped down to $40 per barrel in December 2015. Leo Chen who is the quantitative analyst at Cumberland Advisers called this correlation a “black swan”. According to him this correlation between oil prices and stock prices is not usual.  
From past five years the correlation between S & P Index and the oil prices was negative 71.8%. This shows that the stock prices and oil prices move in opposite direction. If oil prices rise, the stock prices fall and vice versa. However, from past twenty years this correlation has not been more than 25% as compared to current 91%.

Now the question here is what is so few and far between now and then?
As we know that these days the oil prices have been declining from the last quarter of 2015 in the international market. However globally this drop is not being considered as a good news. But why?  Why this decrease in oil prices is not welcomed in the economy?
It’s quite complicated!
There are many reasons behind this and different analysts and investors hold different view point. Some believe that this drop in oil prices is bad news for the corporates as it would affect their profits in the long run due to less demand of oil. This also includes productive economies like China, where the growth productivity has gone slower. Another school of thought relates it to prevailing trend of dollar in the exchange rate markets.
In order to understand the phenomena behind the swift dropping of oil prices, you may visit my article Dropping Oil Prices: An Alarm for Saudi Arabia. To get more information on current trend of dollar in the exchange market, visit my article
We may believe that there are several other ingredients involved in this oil and stock curry which are adding flavors to confuse the whole recipe. We may also say that if the investors would take a flight from commodity markets due to prevailing uncertainty and high risk aversion then the volatility in the stock market may also be another reason for the stock market and the oil prices to move in same direction against the norm.

However, the good news is that recently the slight temporary boost in the oil prices also raised the sentiments on Wall Street and the Dow moved up sharply. The blue chip companies got up with 153 points. 

Friday, 8 April 2016

What Put Gold Market On Fire?

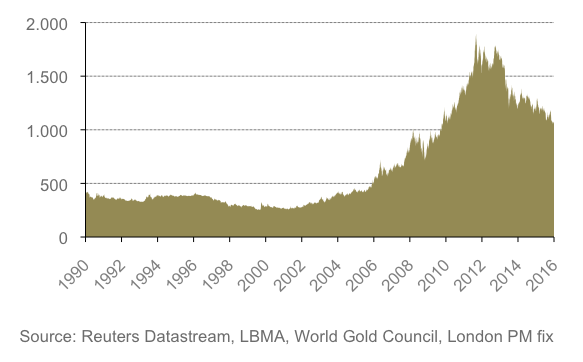
Gold price is on fire. It looks like something big has happened in the gold market. There was a magnificent change of trend in the gold prices from the mainstream during the first quarter of 2016. This shows that the investors are having insecurity about stock market and they are finding a way towards safe investment somewhere else… gold market may be…
Over the past several years gold market the gold market has been agonized by the decline in the outflow of gold from Gold ETF’s and Funds. This decline in the new outflows brought a drastic change in the international gold market in first quarter of the year.

According to Gold Demand Trends of World Gold Council the entire gold market suffered the net outflows from Gold ETF’s and such similar funds except for the small outflow of 25 metric ton that was built during first quarter of 2015. In the first quarter of 2016, this out flow was built up to 363 metric tons which is actually recorded to be the second highest build in the history of Gold ETF’s and Funds.
The first highest metal inventory was built at Global Gold ETF’s and Fund in first quarter of 2009. This was the time when stock markets were crashing down at their lowest levels. AT that time, the Global Gold ETF’s and Fund inventories rushed at 465 metric ton which was the highest ever.
There three important factors that act as driving force for bringing major change in gold markets are:
  1.  Net Sales and Purchases by Central Bank
  2.    Demand of gold coins and bars
  3.         Gold ETF’s and Fund Flows

When the Central Banks in West dumped 663 metric tons of gold in the market by the year 2005, the result was decline in the demand of total gold investment that reached 58 metric ton. This can be compared to the situation of gold investment demand of the year 2012 when it reached 2174 metric ton. This was an outrageous swing in the investment demand of gold with the difference of 2232 metric tons from 2005 to 2012. This catalyzed the prices of gold to hit as high as $ 1669 in Q1 of 2016.
In current situation, the investors need to realize that the popping up of wide Bonds and Stocks markets by Fed and other central banks won’t last forever. There might even be the possibility that Gold ETF’s and Fund Flows won’t even be having the gold that has been declared on records. The evidence of this is massive investments in paper gold. The investor only invests in the certificate and never gets to have gold in physical form. Most of the demand of gold investment is fulfilled this way. What investors really need to know is that if the flow of the mainstream investors would sign of things to come in future the things are really going to take new twists and turns by the year 2017.